OUR VIEW
Last December we analyzed the U.S. Public D&O insurance market, using price changes by size of insured, by outcome and by attachment band, Schedule P analysis, loss ratio analysis and large loss analysis. We identified a “volatile, boom-and-bust market untethered from empirical data and unhindered by logic”.
Unfortunately, not enough has changed since then. Insurance prices continue to drop across all segments as established and new capacity seeks to buy its way onto fiercely defended programs. As a result, current prices remain incompatible with long term profitability.
OUR METHODOLOGY
We separate Financial Institutions and sub-divide Commercial by insured company size and attachment point:

We exclude IPO/SPAC/deSPACs (where identifiable) to prevent large-premium items from skewing the results.
We focus on price rather than rate to exclude (untrackable) changes in coverage.
Our ‘pure price’ analysis excludes loss trends (so ‘flat’ is negative in real terms).
Our analysis is based on ~40,000 commercial policies.
OUR ANALYSIS
A. QUARTERLY CHANGE SINCE Q1 2022
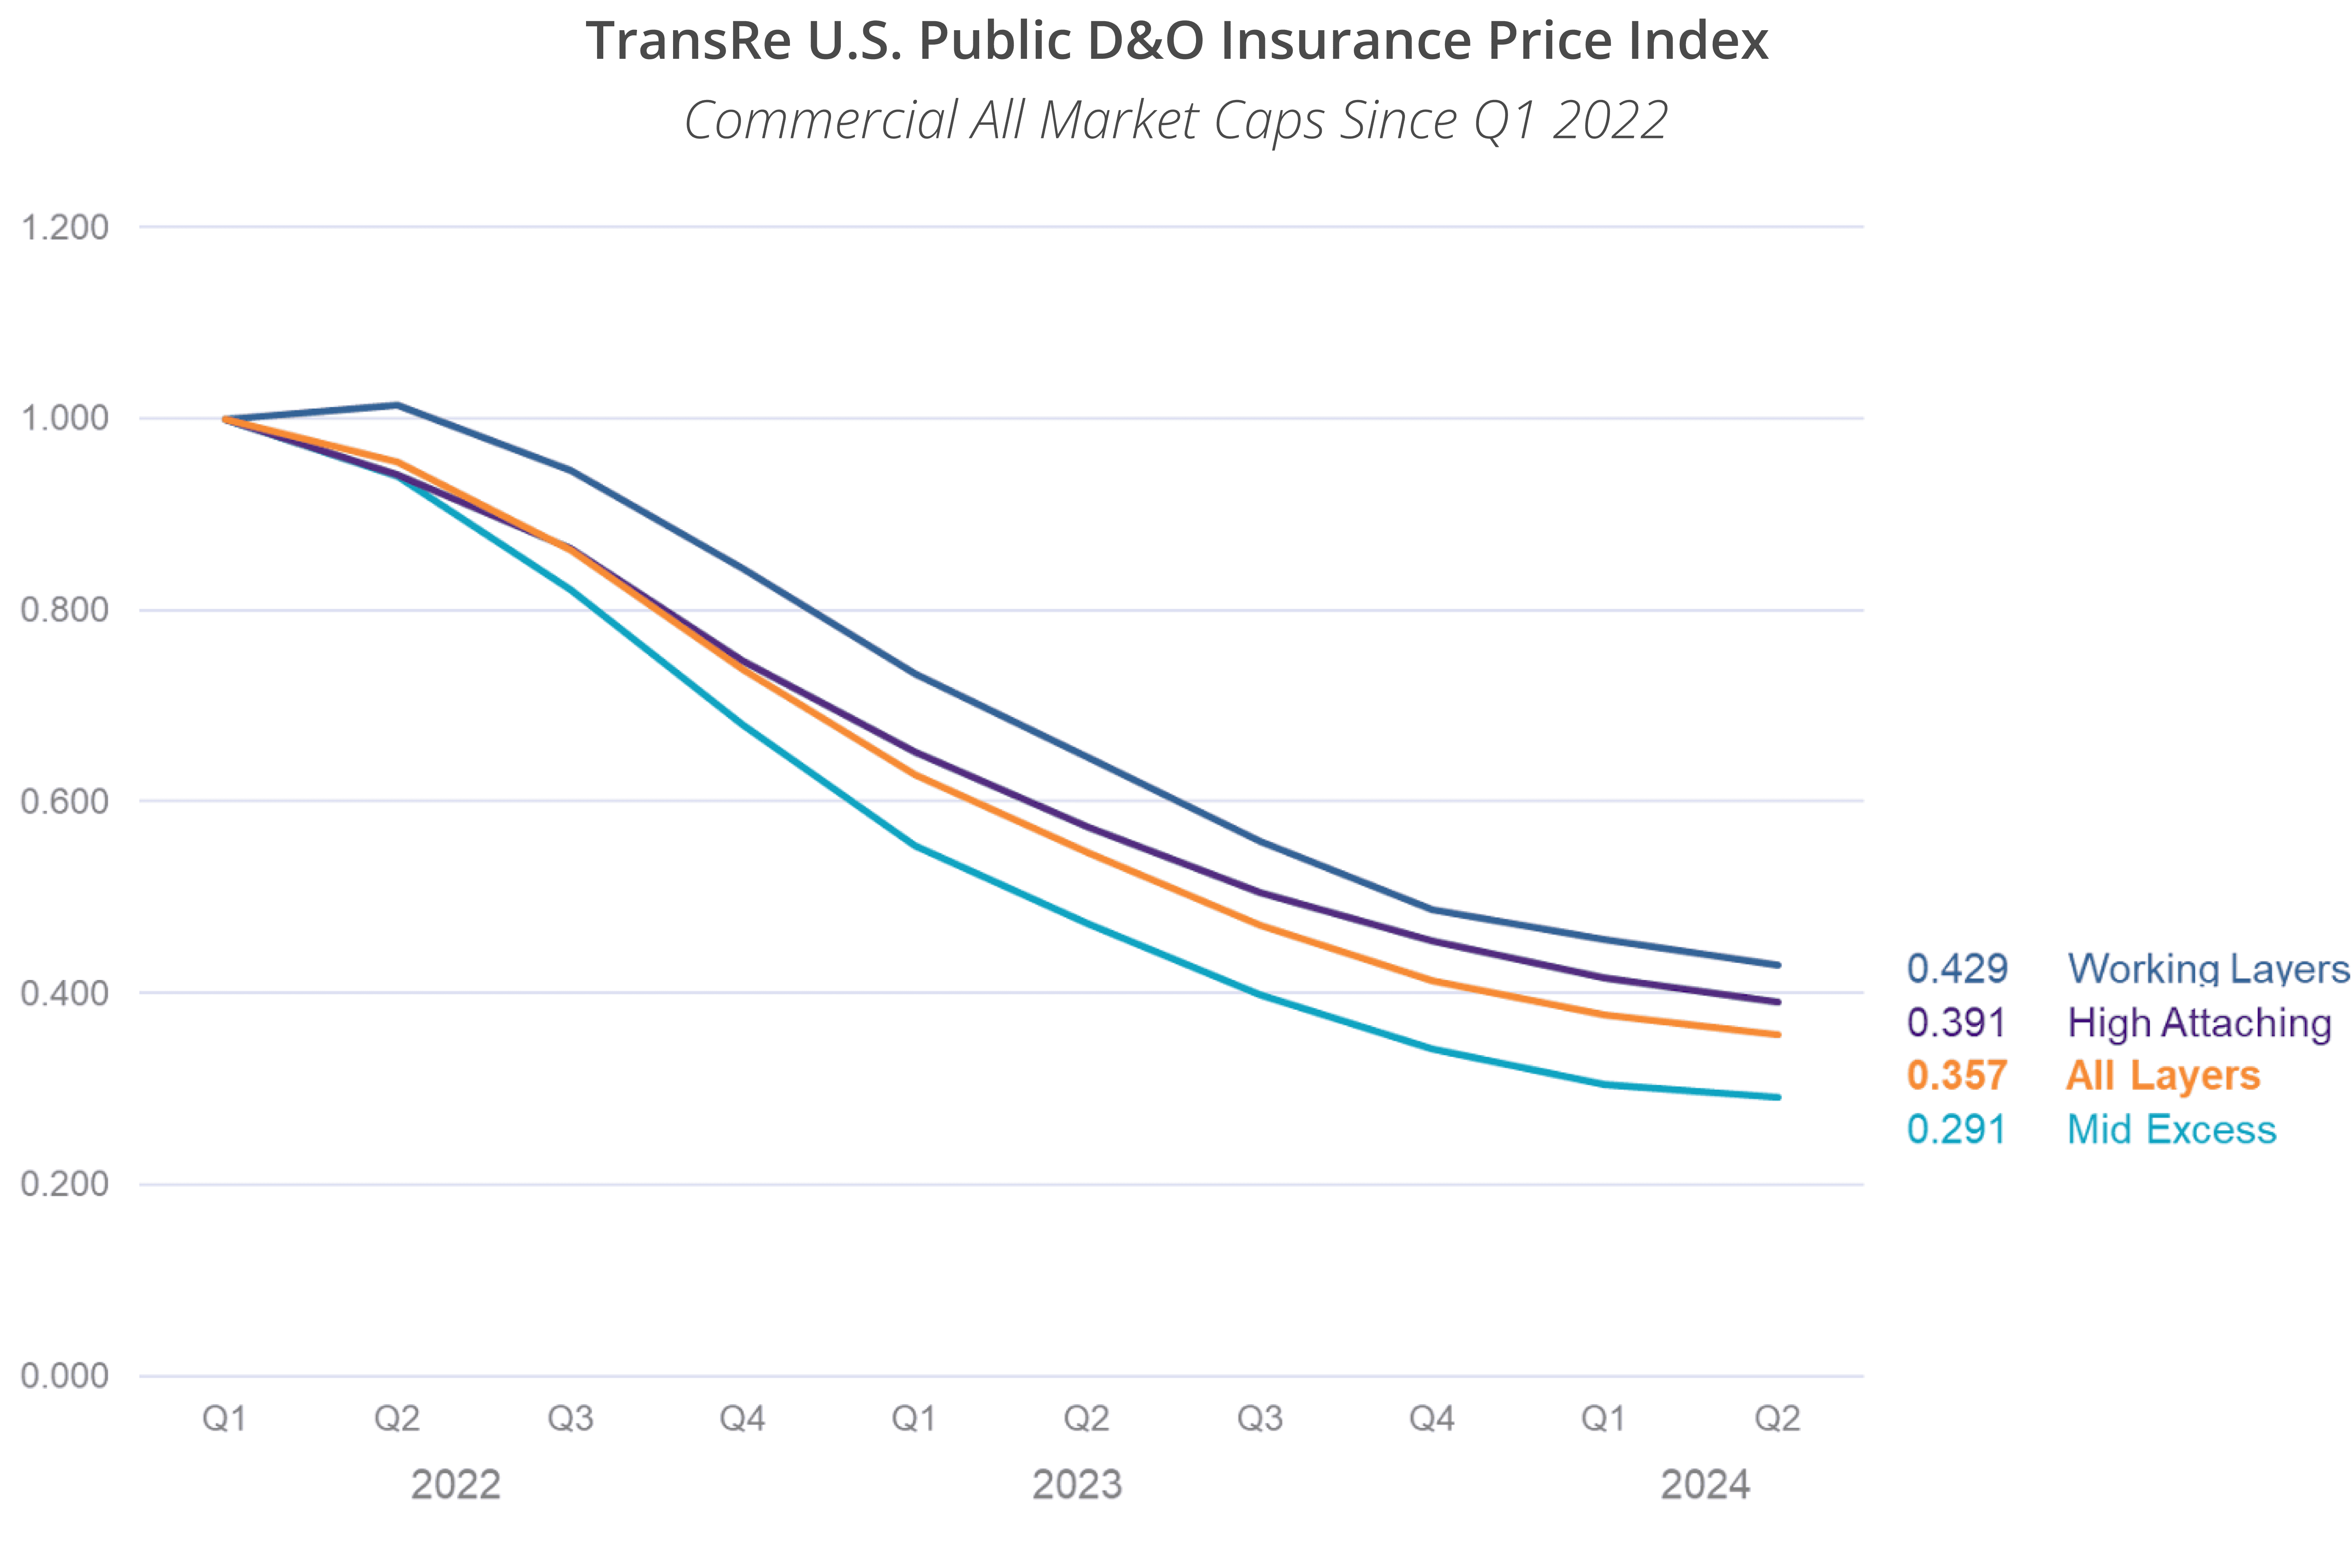
We start with a look at the market from its most recent peak.
All layers are only just more than a third of their early 2022 price, reflecting the intense competition, while high attaching are likely already at minimum premiums.
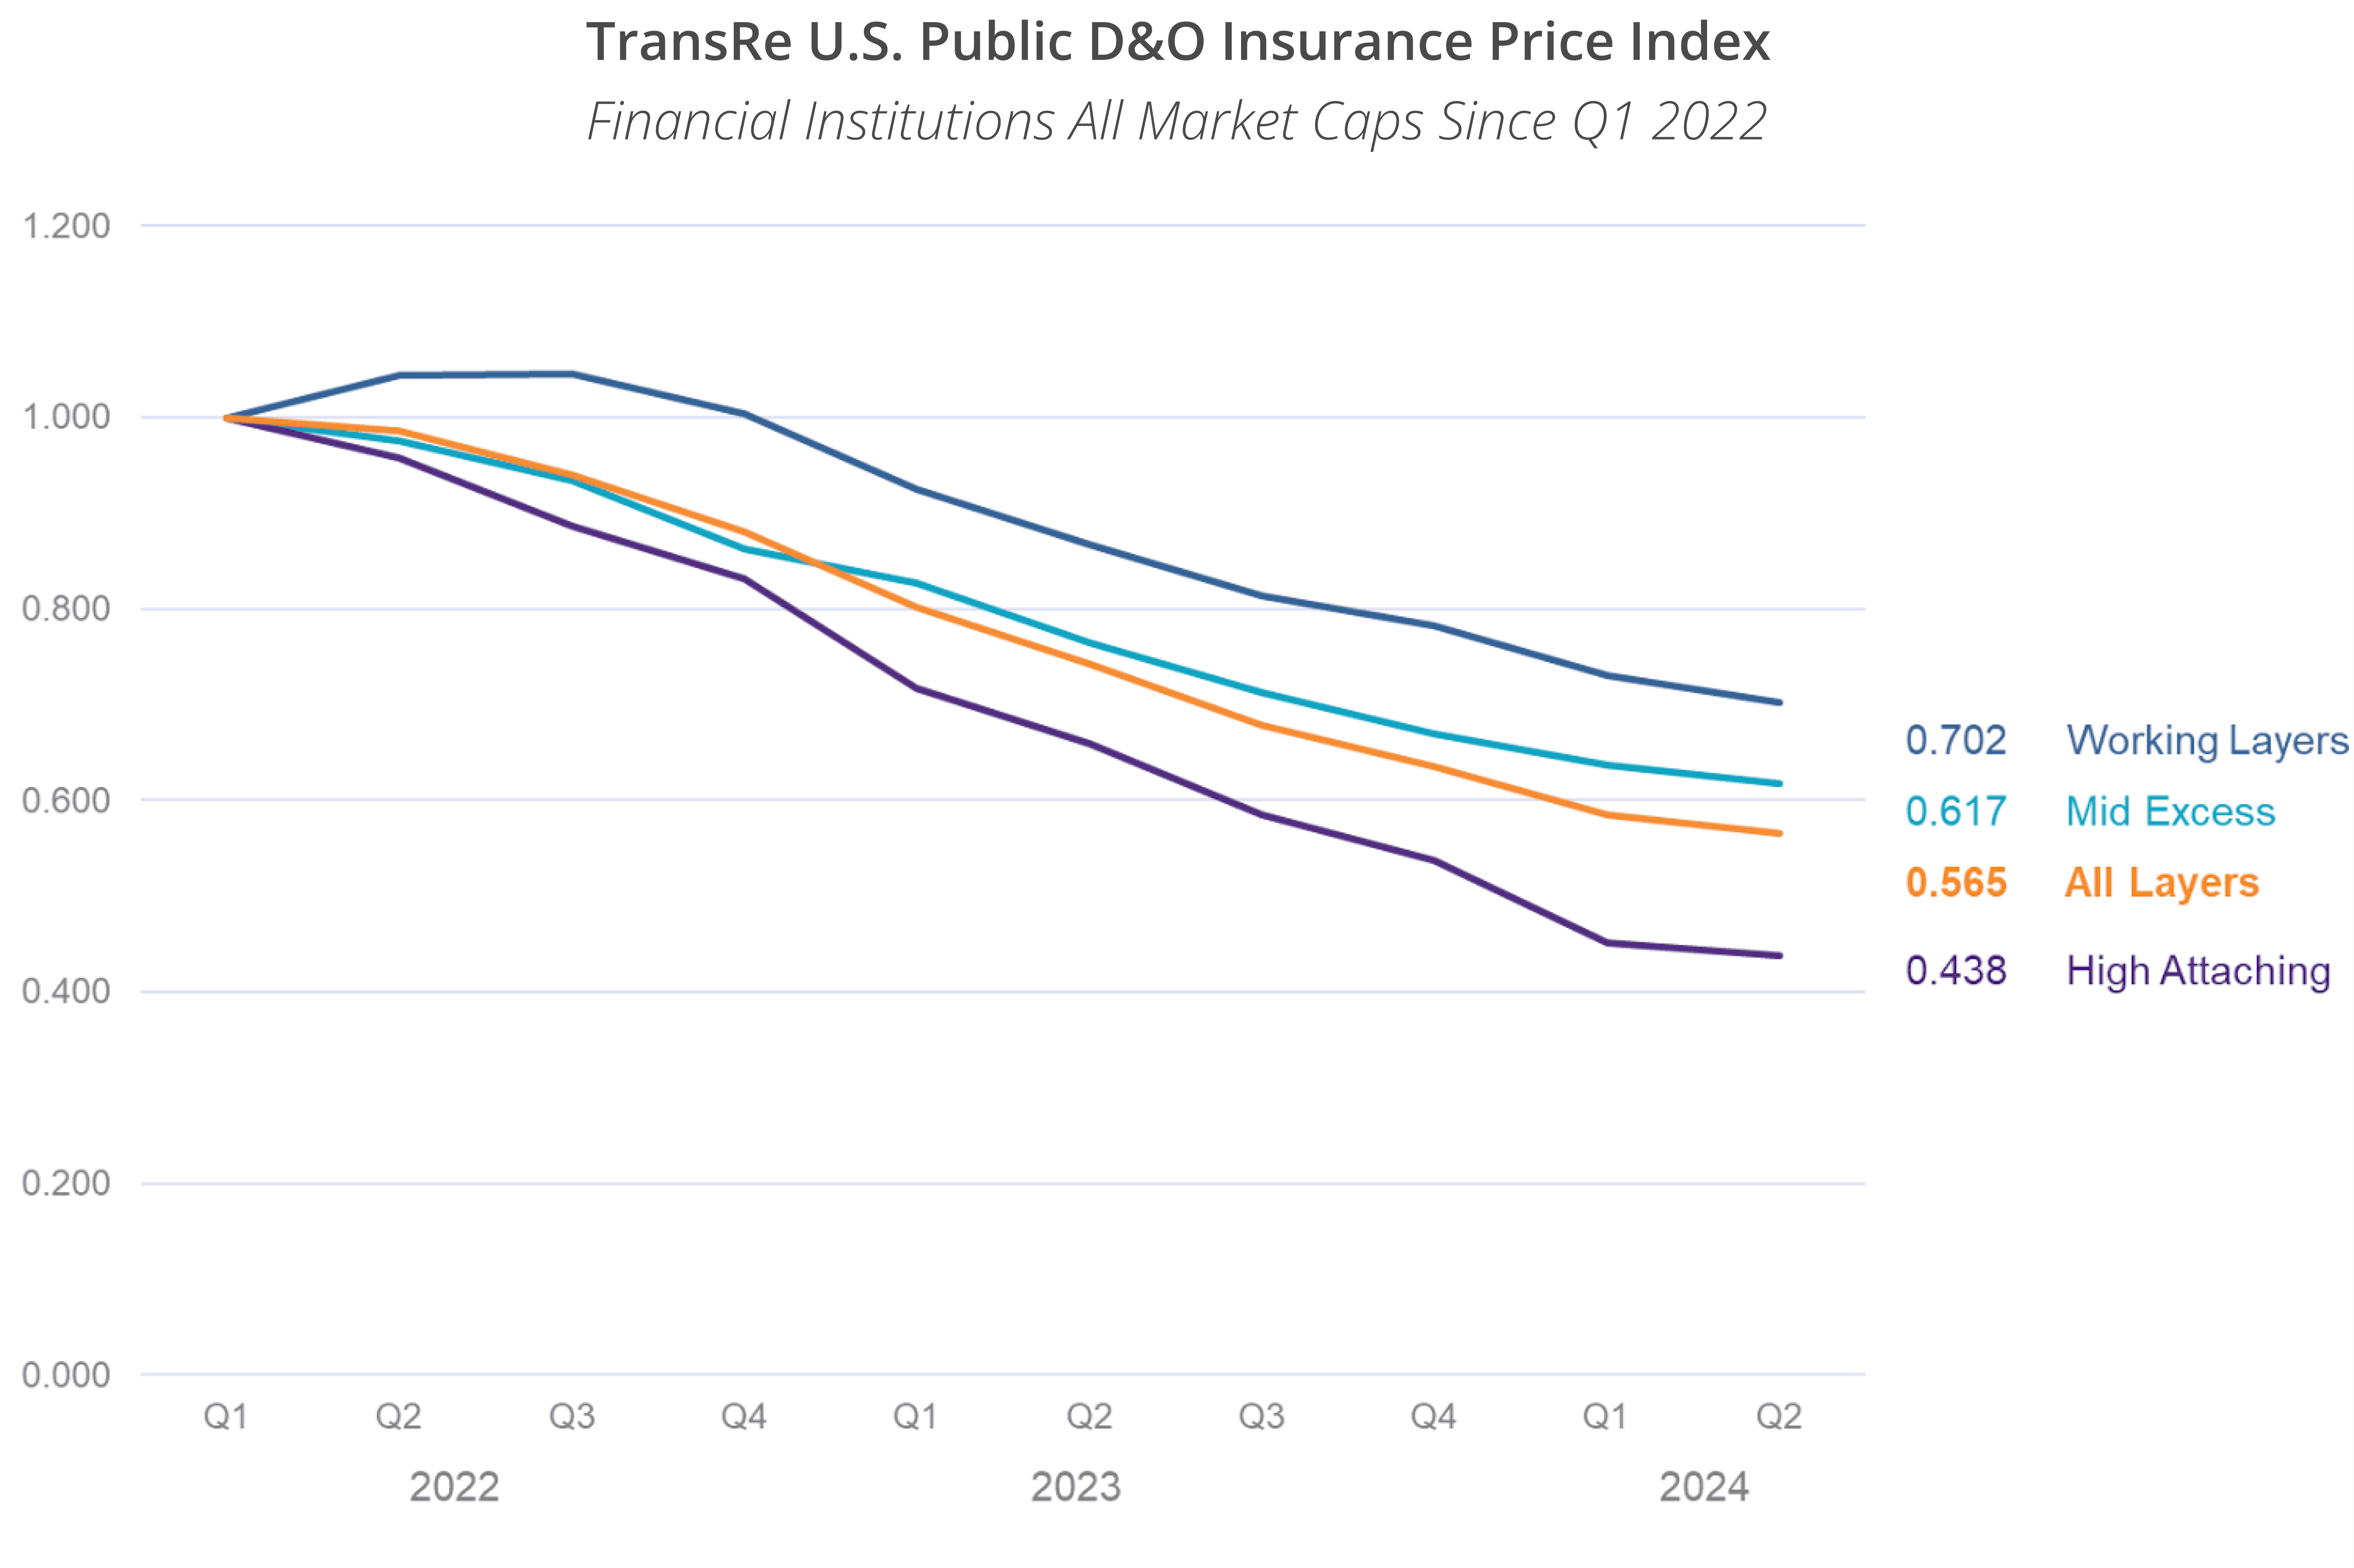
Financial institution prices are moving in the same direction, although not as severely.
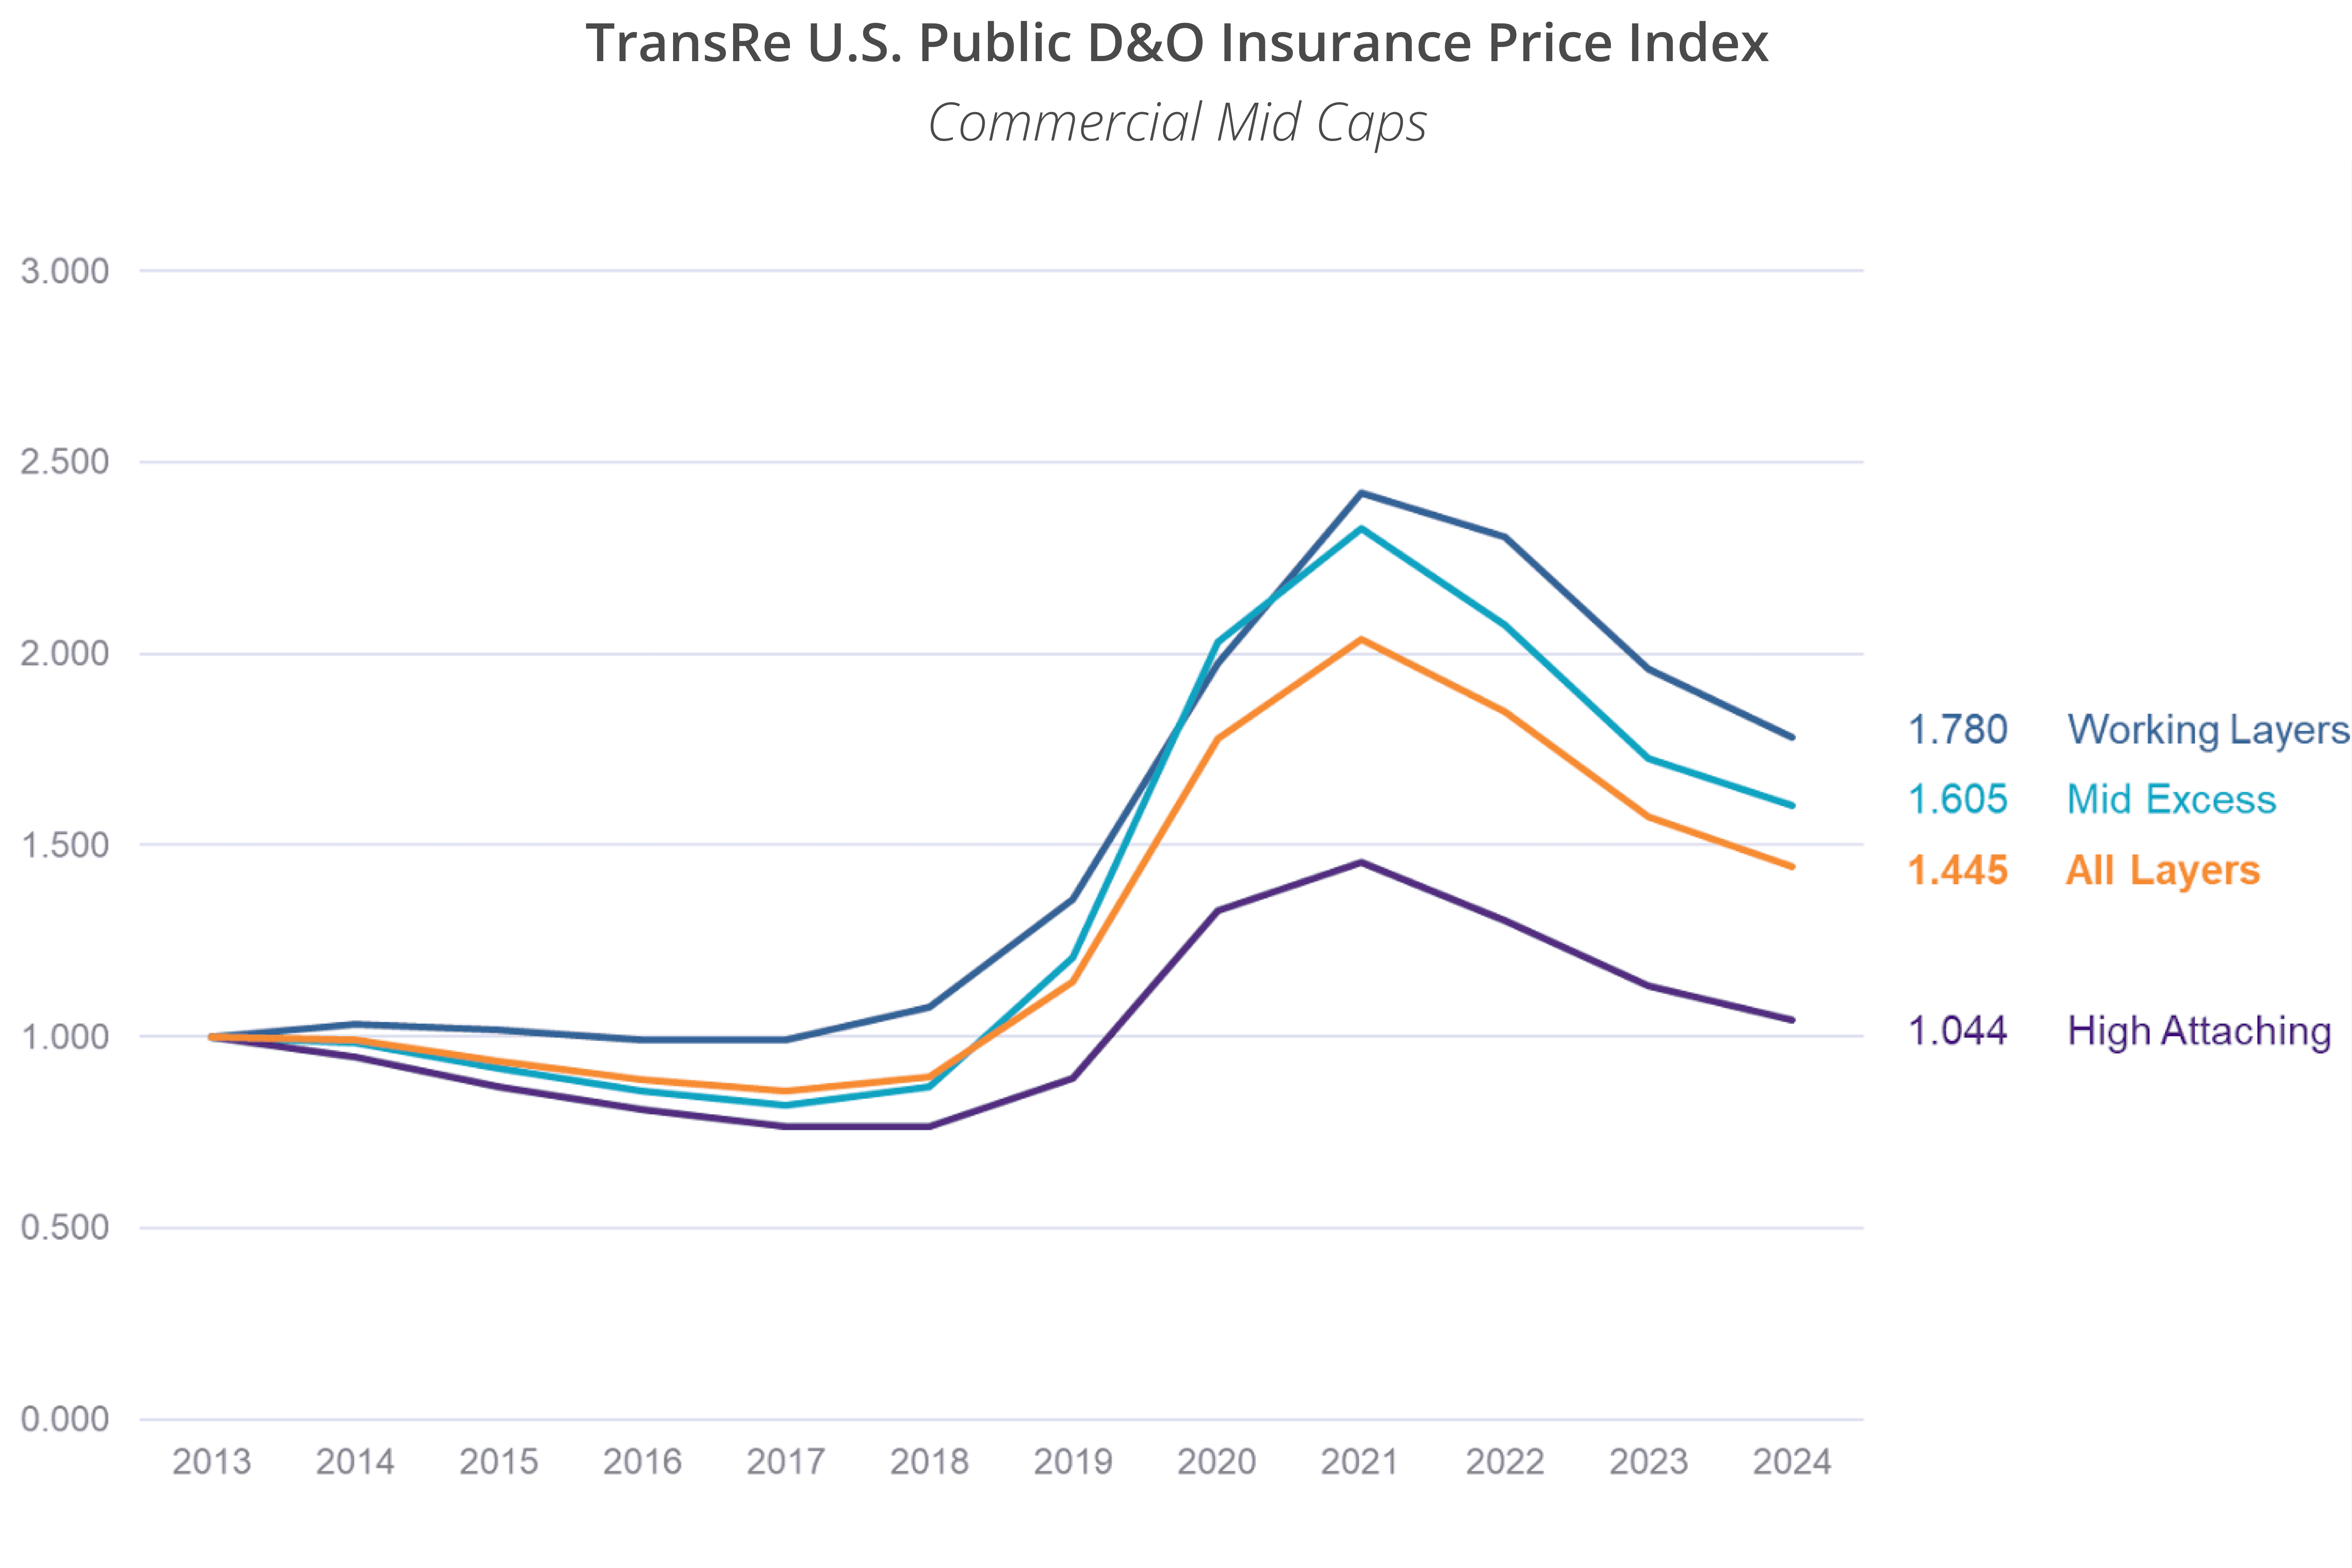
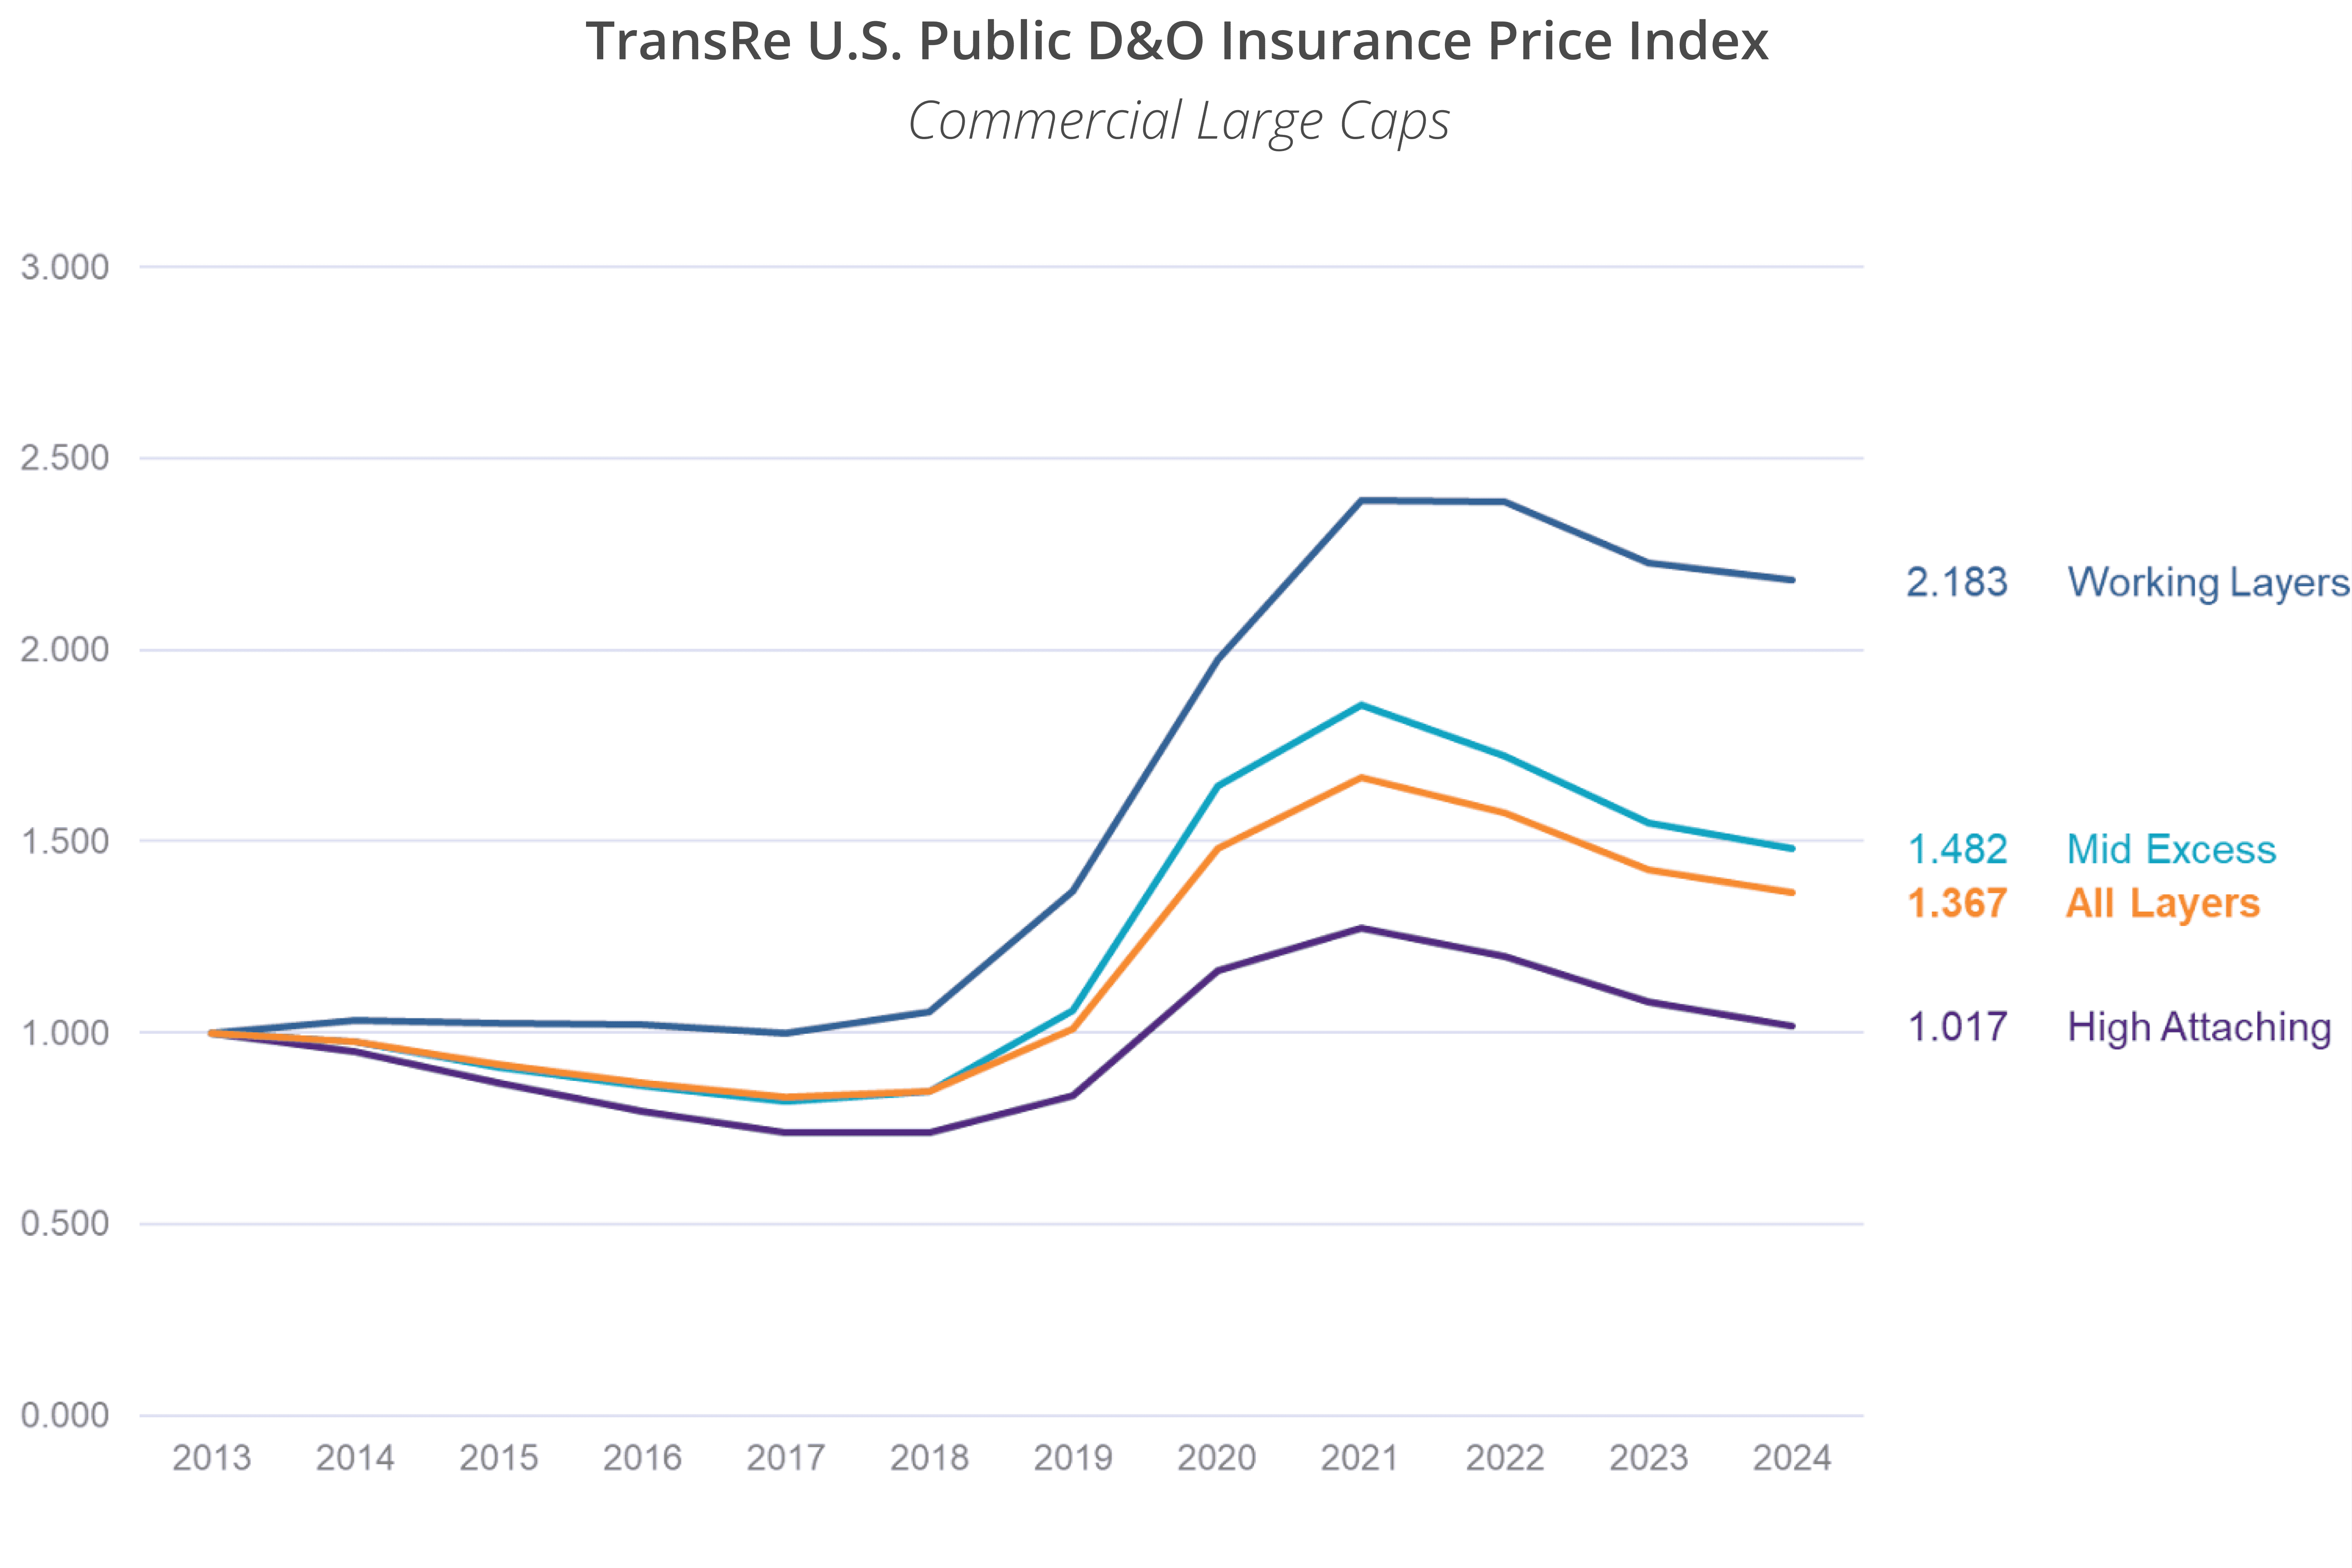
B. ANNUAL CHANGE, BY SIZE OF INSURED, SINCE 2013
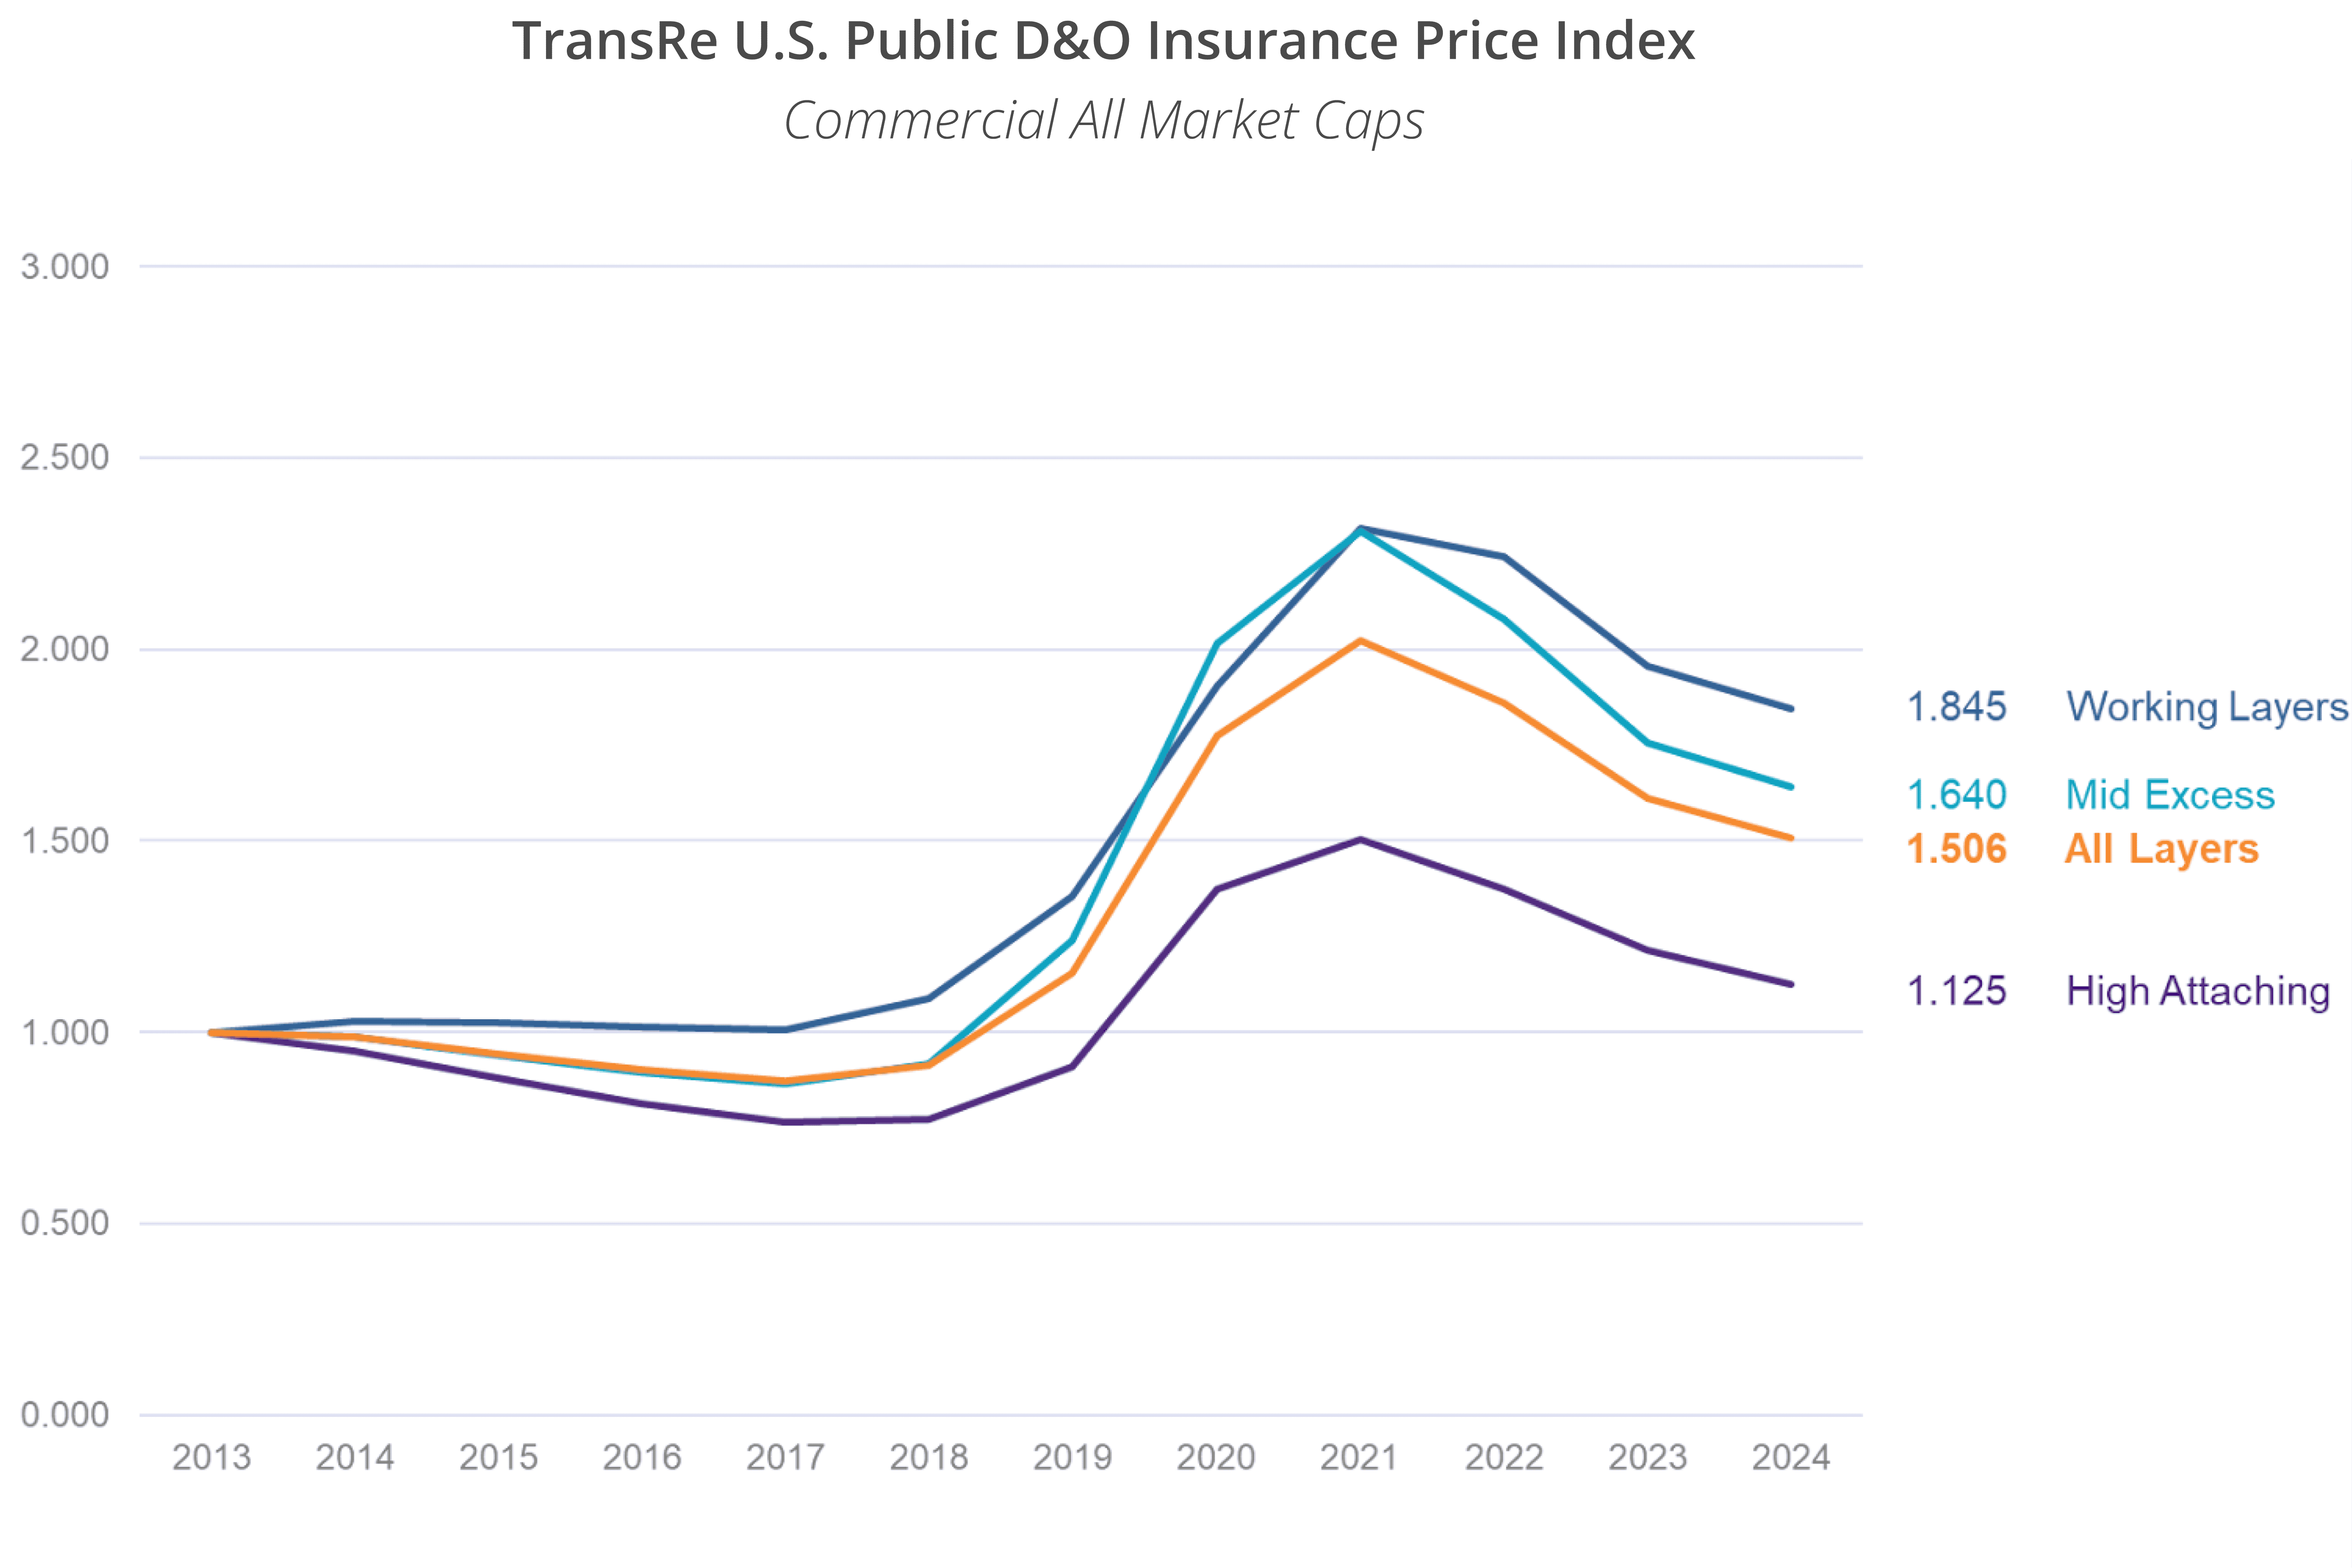
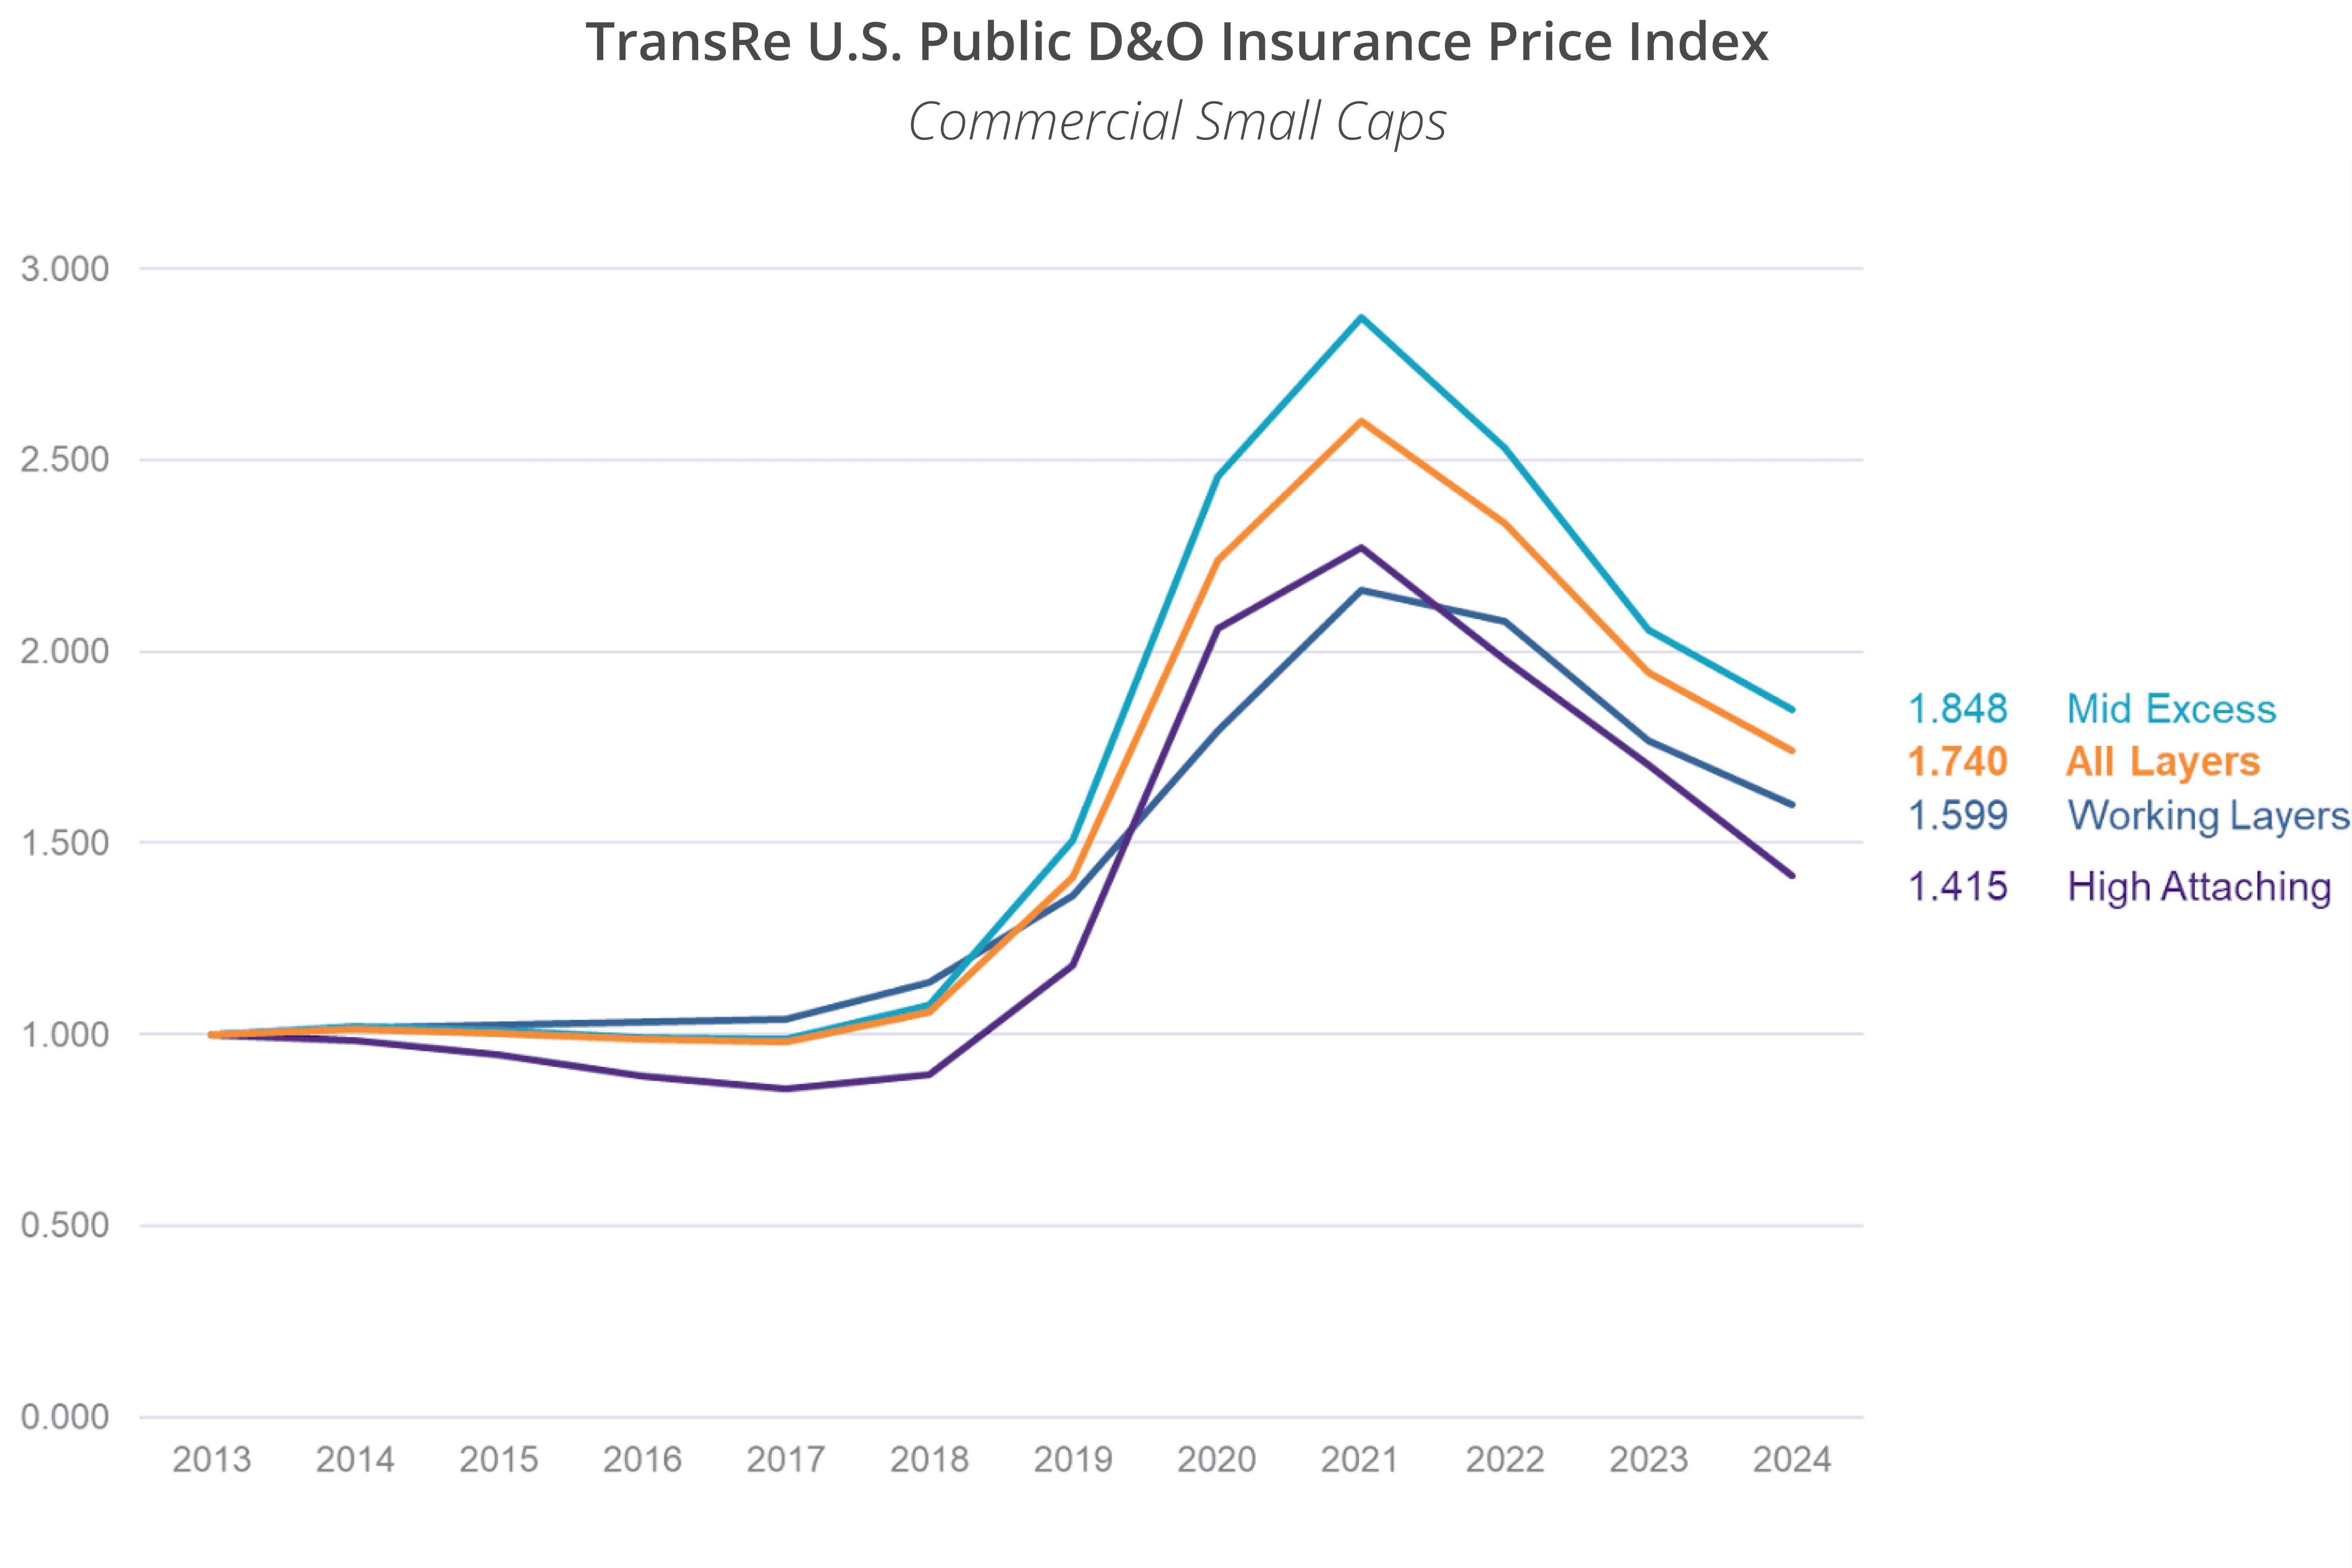
As you would expect, working layer prices have held firmer than high attaching layer prices overall.
However, small cap working layer prices have dropped more than mid-excess.
High attaching layers for commercial midcaps are now almost exactly where they were in 2013. Has nothing really changed since then?
At least the working layers for large commercials show some price resilience, because they are the most frequently impacted by loss activity.
Financial institution pricing has been the least volatile, but 81.7% of 2013 prices for high attaching layers is a concern.
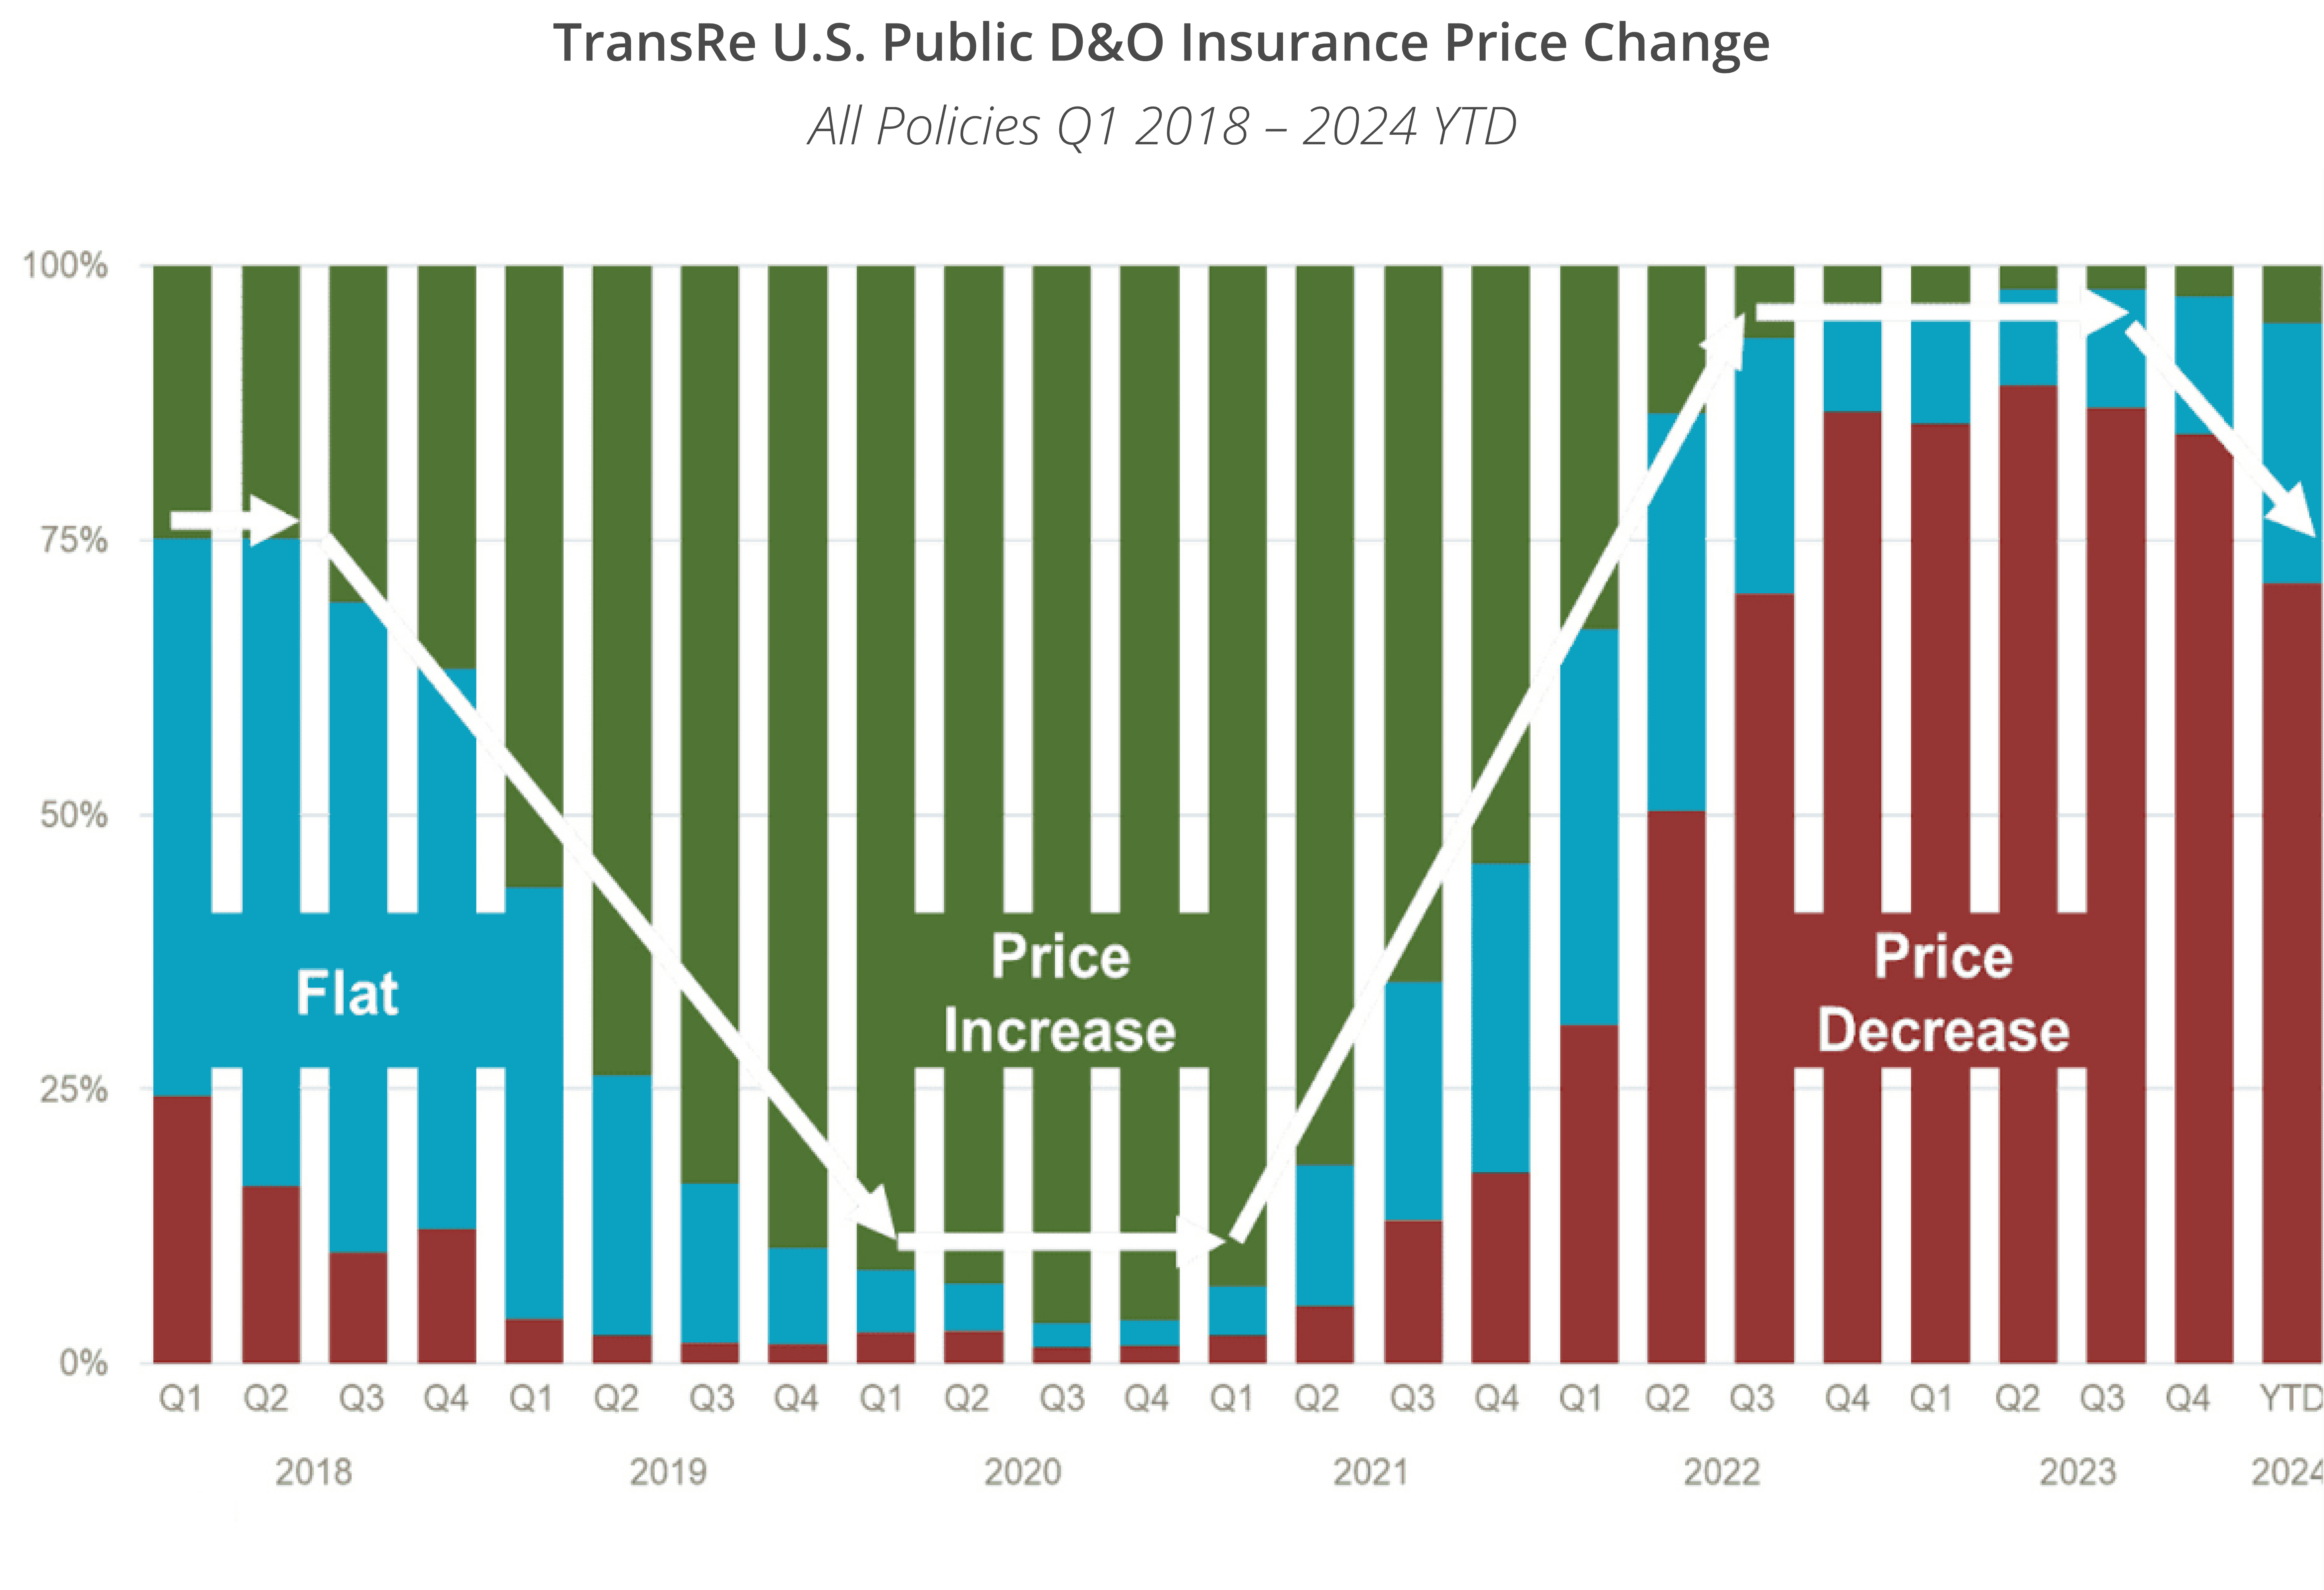
C. QUARTERLY CHANGE, BY OUTCOME
We separated ~40,000 policies by whether they renewed flat, price up or price down:
Since mid-2021, “10% off expiring” has become normalized, creating a negative feedback loop. While price reductions outnumber increases, sustainable profits will remain elusive. Our chart shows what we all know – that markets can move quickly, in both directions.
WHERE NEXT?
Half-way through 2024 and most of the 2020-2022 increases have been given back, leaving the overall market on an unsustainable trajectory.
On the upside, we see early signs of a turning tide. Insurers have started to resist (unwarranted) premium reduction requests. ‘As is’ renewals are the first, fragile signs of a transition as underwriters hold strong against insured/broker pressure. That trickle needs to become the trend.
When you’re in a ditch, stop digging.
Contacts
To discuss any aspect of this update, or your ongoing U.S. Public D&O reinsurance needs:
Portfolio Management
Elise McKenzie
Anthony Matteo
Ben Casey
Underwriting
Daniel Hojnowski
George Delaney
Diana Liu
William Seymour
Mathew Yuen
Dierdre Zeppie
Lonny Agulnick (Fac)
Actuarial
Joe Marracello
Kevin Peterson
Claims
Seth Goldberg
You can also reach us at Communications@transre.com.
Legal
Reproduction in any form without permission of TransRe is prohibited.
The material and conclusions contained in this document are for information purposes only and TransRe offers no guarantee for the completeness of its contents.
Statements in this document may provide current expectations of future events based on certain assumptions. These statements involve known and unknown risks, uncertainties and other factors which are not exhaustive. Although TransRe makes reasonable efforts to obtain information from reliable sources, TransRe does not guarantee the accuracy or completeness of the information given or any forward-looking statements made.
TransRe undertakes no obligations to revise or update any statements, whether as a result of new information, future events or otherwise, and in no event shall TransRe or any of its affiliates or employees be liable for any damage or loss arising in connection with the use of the information relating to this document.
